1 Introduction
1.1 Some History
Given its simplicity, linear regression is surprisingly new, being developed in the early 1800’s for predicting the positions of planets by Legendre and Gauss (Seal 1967). Its use in social and biological sciences was popularized by Quetlet in the middle of the 19th century. Francis Galton coined the term “regression” in the late 19th century upon noting that the height of a son tended to “regress” towards the overall average: men with tall fathers tend to be shorter than their father, while men with short fathers tend to be taller, regressing towards the overall mean. While much of this initial work looks bad in hindsight (Francis Galton was a leading eugenicist and used statistics to justify his ideology), the fundamental ideas have proven to be very useful across all areas of science.
Linear methods continued to be developed in biology, with many important developments coming from geneticists. In the early 20th century, the field of statistics was born, and an associated theory for linear regression was developed. Much of this was done by Ronald Fisher, who developed many of the statistical tests that we will learn in this course.
By now, all scientific fields that deal with data have some use for linear models. This was greatly aided by the invention of computers, allowing linear models to be applied to large datasets with many independent variables. Linear regression is, for example, a building block of modern machine learning methods, is applied widely in finance to forecast stock prices, and is used in medicine to predict patient outcomes.
1.2 Data Collection
For the most part, this course will not concern itself with the data collection process, which is unfortunate because understanding how and why the data was collected is extremely important for trying to draw robust conclusions from it.
Data is collected for many purposes, and it is difficult to numerate all of the different reasons. A couple of examples we will deal with include:
Surveys might be conducted by governments, with the primary aim being to inform policy decisions; for example, the U.S. government runs the Medical Expenditure Panel Survey (MEPS) to help inform healthcare policy. The way that this type of data is collected is often extremely complicated, as it is important to get a representative sample of the population to participate; it is also very difficult to draw conclusions about policies because, famously, correlation does not imply causation. Other uses of surveys might be, for example, to predict the winner of an election by asking prospective voters who they plan to vote for.
Trading firms might collect data on the stock market for the purpose of forecasting how stock will perform. The goal here is to predict the movement of a stock so that the firm can make money. Forecasting (i.e., predicting the future) is useful for lots of other purposes, such as gambling, informing business strategy, etc.
Hospitals and medical companies perform clinical trials to assess the efficacy of interventions; they want to decide whether a particular drug is effective at treating a disease, or identify promising drugs among many candidates.
Scientists often collect data for the purpose of theory building. For example, particle physicists collect data (under carefully controlled settings) to test different aspects of the “standard model of particle physics.” Often this data is very noisy. In these cases, usually the theory will make some sort of prediction, and the goal of the data collection is to either validate or disprove that prediction. While this is framed in terms of “hard sciences” this type of quantitative theory building is common in all areas of science, from physics to sociology.
Computer scientists collect data for the purpose of training machine learning systems. The way that this is done is usually by constructing powerful prediction systems. The goal here, ultimately, is to build machines that can interact with a facsimile of intelligence with the world.
The data collection processes for the problems above are all different. In some cases, such as clinical trials and physical experiments, the data collection process is tightly controlled to eliminate sources of systematic bias and ensure that conclusions drawn can be interpreted as causal. For example, in clinical trials individuals are randomly assigned treatments to eliminate the possibility that (for example) sicker people are systematically assigned to the treatment (this would make the treatment look ineffective). At the opposite extreme, data used in machine learning or policy research is often a convenience sample - it is used because it is there, and exists, even if it was not collected for the purpose we are using it for. Working with convenience samples can be very tricky, as often the data collection is systematically biased: maybe only old people answer calls in a phone survey?
1.3 Data Analysis Recipe
The following section gives an overview of how to generally think about the data analysis process. The main concepts are shameless taken from Roger Peng, who represents the data analysis pipeline in the following figure:
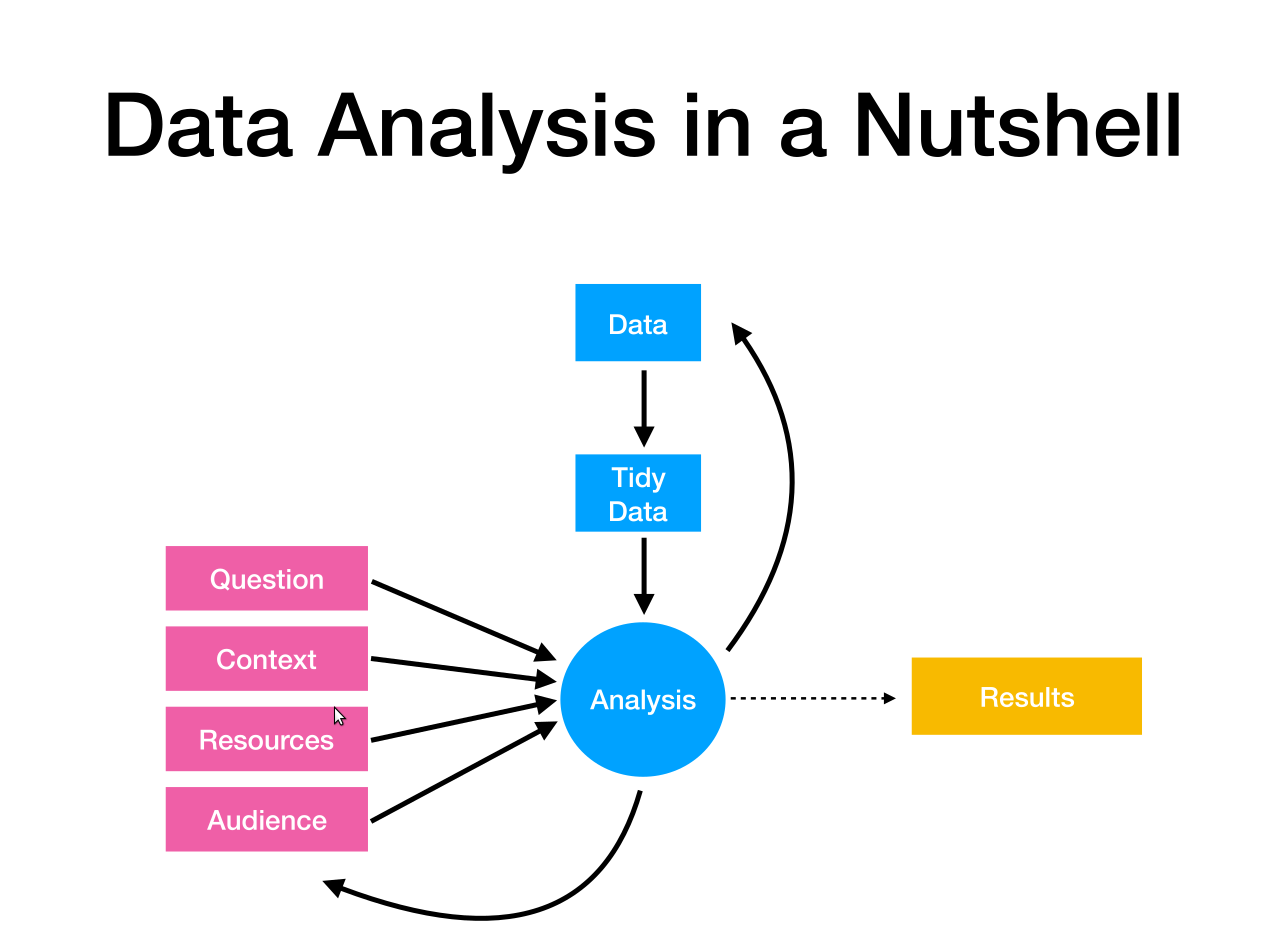
I expect that most of the students in this class will usually be in the audience, rather than being data analysts themselves! While some of you may go on to work in data science, most of you will not be involved in the data collection or analysis processes. An understanding of the overall workflow will nevertheless benefit your understanding, regardless of whether you are part of the audience or not.
The rough process is:
Having a question you want to answer or problem you want to solve.
A dataset that you think will be able to answer the question. If the dataset doesn’t exist, you will need to collect it; if it does exist, but isn’t up to the task of answering the question, you will need to reassess your plans. Aside from the project, you won’t work on data collection in this course.
The initial data we collect will usually be unwieldy and require some tidying. This is an important part of the process, and if you want experience with this then you should take SDS 322E.
Usually, some amount of visualization is done to help refine our question or alert us to any problems that we have not considered. UT Austin offers courses in both data science (SDS 322E) and visualization that is useful at this stage.
We then attempt to formalize the question in terms of a statistical model, sketch a solution using that model, and analyze the data. This is the bread and butter use of the linear regression model.
This is usually followed up by some type of model assessment or sensitivity analysis. How reliable were our results? Are there any ways in which the data seems to be in conflict with the model we used? We will also spend a lot of time on this part of the analysis pipeline.
The analysis out at the end often suggests new questions, or refines your old questions, to the extent that you actually need to embark on a new data analysis problem, at which point we cycle back up to the beginning.
The quality of the question/problem, and how well formulated it is, is very important! My preference is that these questions not be framed in terms of statistical models, at least at first. They should be questions that can be explained to those with no statistics background, and typically start out quite vague. Good questions are:
Not too vague; the question should be specific enough so that you can identify what a solution to it would look like.
Not too specific; asking very narrow questions requires substantial amounts of, often highly specialized, data, and might not lead to widely-applicable insights.
Have implications: answering the question should support/falsify a scientific theory, support a policy intervention, inform a business decision, etc. Answering the question should have clear relevance.
In this course, we will generally start with the dataset and a somewhat vague question. We will then refine the question until it is amenable to a statistical analysis using linear regression.
1.4 Some Recurring Examples
Below, I will list some questions we will try to answer throughout the course. At this point they are vague, and we will refine them as we work through them.
How well does high school GPA predict performance in college, and how does its usefulness compare with that of standardized tests? To attempt to answer these questions, we will use data collected on college freshman after their first year.
Does air pollution impact housing prices? We use data collected on census tracts in Boston to see if houses tend to be less expensive in areas that have higher amounts of nitric oxide in the air.
Does smoking by mothers during pregnancy have any harmful effects on their children? We use data collected from pregnant women in North Carolina on the birth weight of children to try to answer this.
How well does educational attainment and IQ predict an individual’s salary, and are these variables more or less important than other indicators such as sex or socioeconomic status (SES) of the parents? We use data collected on individual wages to try to answer these questions.